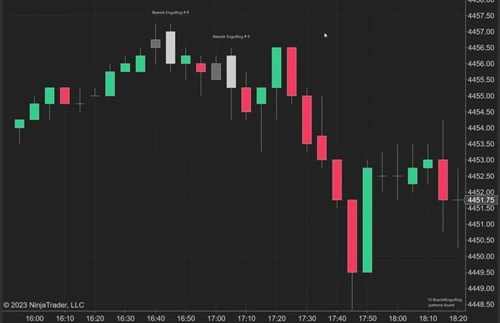
Technical analysis relies on various chart formations to provide insights into potential market movements. How do traders distinguish between continuation and reversal setups? What signals help in making precise trading decisions?
Different price movements structures, such as the cup and handle pattern, Doji, and engulfing formations, play a significant role in identifying shifts in momentum. These patterns reflect market psychology, showcasing the balance between buyers and sellers at critical points. Understanding how these formations interact with volume and key price levels enables traders to refine their strategies and improve trade accuracy.
Single Candlestick Patterns

Certain formations consist of a single bar and provide crucial information about potential price reversals or continuations. Market trends can also be influenced by external factors, such as monetary policy, which affects overall market liquidity and investor sentiment.
Doji
A Doji develops when the opening and closing prices are nearly equal, forming a small or nonexistent body. It reflects market indecision, signaling a potential reversal at key support or resistance levels. A confirmation candle after a Doji strengthens its predictive power.
Hammer and Hanging Man
A Hammer appears at the end of a downward movement and suggests an upcoming upward reversal. It features a small body with a long lower shadow, indicating increased buying interest. In contrast, a Hanging Man emerges at the peak of an upward trajectory, warning of possible downward movement. Though structurally similar, their placement within trends differentiates their implications.
Double Candlestick Patterns
Formations involving two bars provide stronger confirmation of price direction changes.
Engulfing Formations
A Bullish Engulfing setup forms when a larger green candle completely engulfs the prior red one, suggesting an upward reversal. Conversely, a Bearish Engulfing structure develops when a red bar overtakes a smaller green one, signaling a potential downward trend shift.
Tweezer Tops and Bottoms
Tweezer Tops consist of two consecutive bars with nearly identical highs, indicating resistance and potential downward movement. Tweezer Bottoms, in contrast, feature two bars with matching lows, suggesting strong support and an upward reversal when found in a declining market.
Triple Candlestick Patterns
Patterns formed by three bars often serve as powerful indicators of price momentum changes.
Morning Star and Evening Star
A Morning Star consists of a large red bar, a small-bodied candle, and a strong green bar, confirming an upward reversal. An Evening Star follows the opposite pattern, with a large green bar, a small indecisive candle, and a strong red candle indicating a bearish shift.
Three White Soldiers and Three Black Crows
A Three White Soldiers formation features three consecutive rising bars, reflecting strong buying interest and upward momentum. In contrast, a Three Black Crows formation consists of three successive declining bars, warning of aggressive selling pressure and a potential downward trend.
Continuation Formations
Certain formations reinforce ongoing price trends rather than signaling reversals.
- Rising Three Methods involve an initial strong bullish candle, followed by three smaller bearish ones, and a final strong bullish bar, confirming the uptrend.
- Falling Three Methods exhibit a similar pattern but in a downward trend, with smaller bullish candles within a bearish setup, reinforcing continued price weakness.
- Marubozu suggests further gains, while a Bearish Marubozu points to sustained declines.
The Power of the Cup and Handle Pattern
The cup and handle pattern is a powerful bullish continuation signal. The “cup” resembles a rounded bottom, showing consolidation. The “handle” forms a small dip before a breakout. This pattern signals a strong upward move ahead. Traders often use it to enter trades with confidence without worrying about factors like monetary policy. Identifying the handle’s breakout is crucial for optimal entry points. Recognizing this pattern gives seasoned traders a competitive edge.
Recognizing price movement structures enhances precision in decision-making and risk management. The cup and handle pattern, along with other formations, provides valuable insights into potential price shifts. Identifying these setups at key levels can enhance trade execution and risk assessment. Incorporating these tools into a well-structured approach helps traders navigate complex market conditions with greater confidence.


